Indie game storeFree gamesFun gamesHorror games
Game developmentAssetsComics
SalesBundles
Jobs
Tags

The particles rely on GM's built-in particle system, so it could be limited by how efficient they have made things internally.  Unfortunately, GM still has a very old graphic API implementation, and yes, you will find performance for lesser things will cost more than newer games like you mentioned.

To troubleshoot, please answer:

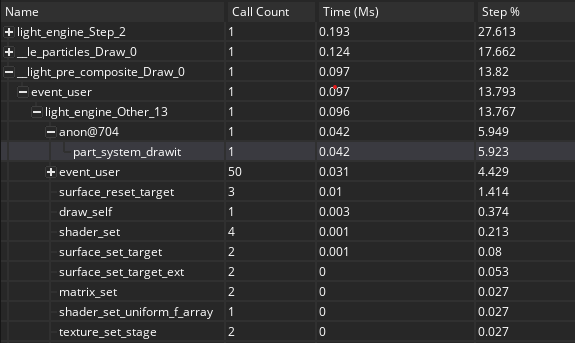
  • What is the actual time in milliseconds that you can see?
  • Have you ran the same test compiled with YYC? (you'd need to output your own timing or FPS values)
  • What is your GPU utilization actually at when the FPS is that low?  (Task Manager > Performance > GPU)

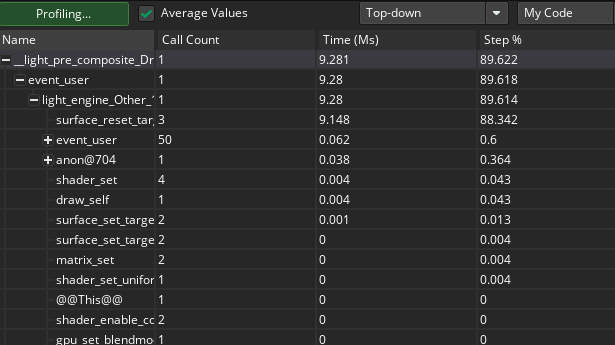
surface_reset_target() is a pipeline change, but saying that is the most costly thing is actually good, because it is not costly.

15% of the step is fine (but we really need to know milliseconds), and it is normal for rendering to cost the most performance.  The question is where is the other 85% going?  GM did recently change some things about particles, and there could be a lot of data going between CPU and GPU which would be slow if done poorly.

For example, I added 20 of those particle fire lights and ran the profiler:

The important ones to look at here are: 

NameTime (Ms)
surface_reset_target0.01
part_system_drawit0.042

These are great metrics, and this is with VM of course.  So, it would be faster with YYC.

My computer is not a good benchmark though, because I build a new one a few months ago with a 4090 RTX and other high-end parts.  I have tested Eclipse on mobile, Surface Pro (2014), and my old Linux machine/server.  Never seen a problem with particles, so I'm curious what it looks like for you?

I have not tried YYC. Should I simply not use VM? 

I did realize that windows has been using my integrated card (not an awful card though can run way better looking games at 60fps), instead of the better card that is used by Baldur's Gate 3. I added my high performance card to the "Game Maker" app, but when I checked in task manager, it still shows the integrated graphics as being used (my guess is I have to add the project app to high performance, but couldn't figure out how to do that).

I tried running a debug again, and this time it is actually much worse (and what I was getting in my actual project). Essentially, if I use the game maker particle system, I experience 0 performance issues. But if I use the eclipse particle system (e.g., le_effect with particle systems and emissives), performance dips very badly. It is nothing to do with my project however, since I recreated it in the example file you've uploaded. I Added 7-8 le_light_fire objects into the room, upscaled to 1080p, and then profiled with these results. 

(3 edits)

I created an executable for the example project, and set the performance to discrete graphics card, and now I've got 60 fps at 1080p with all the particle effects. Do you think the high step % and ms I posted compared to yours is entirely due to the graphics card and the surface reset target function? I would figure out myself if I could figure out how to make windows run my debugging games from game maker using the better graphics card.

(+1)

Ah, that makes some sense then.  Integrated graphics are going to be extremely inconsistent depending on what rendering is being done.  It is weird that it all sits at surface reset, but how they handle VRAM when its integrated would affect that.

I use a lot of multiple render target (MRT) outputs in the shaders, and I bet integrated graphics do not handle that well at all.  So, yes you'll want to figure out why it decides to use your integrated graphics at all.  If you do not use it at all, then I would suggest disabling it in your BIOS settings entirely.  Then GM will have to choice when selecting a device.