Indie game storeFree gamesFun gamesHorror games
Game developmentAssetsComics
SalesBundles
Jobs
Tags

Waffles vs Pies (for charts and data visualization) Sticky

A topic by Calandiel created Sep 10, 2020 Views: 1,319 Replies: 7
Viewing posts 1 to 7
(1 edit)

I'll keep this short because the subject isn't that complex either.

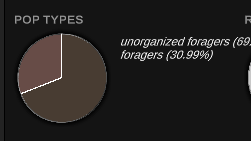
At the moment, we're using pie charts for data visualization, like so:


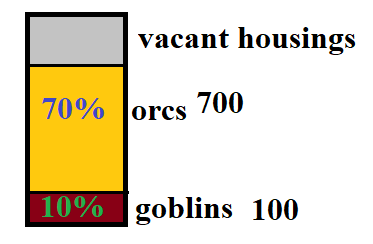
However, we could instead use waffles, like this chart:
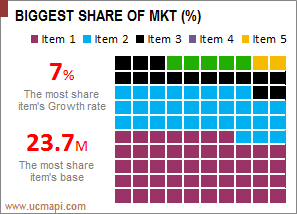

or this one:


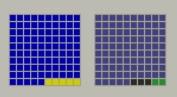
They have less dead space but they may be more difficult to read and only show percentages rounded to the nearest integer. They also have a bit different aesthetic.

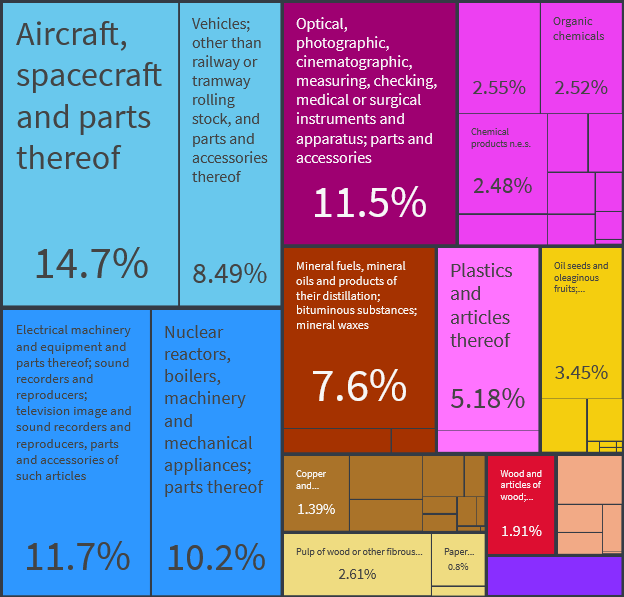
Which one would you prefer? Or perhaps there is some yet different graph you'd suggest for the main data visualization tool (with exception of treemapping, it's a bit too slow to use all over the place)?

I could suggest a simple bar divided in rectangles: 


P.S. This post should be named "Waffles vs pies". Such a missed opportunity.

I used my admin powers to fix it

Do you think it is possible to make the waffle chart look like the OEC's charts ?

No. I mentioned it at the end of the post:

"(with exception of treemapping, it's a bit too slow to use all over the place)"

I think the waffle graphs are much better than pie graph

I prefer pie charts. I think they are easier to read, especially at a glance.  I also find them more aesthetically appealing. I can much more quickly have an understanding of what percentage each portion holds, as the size of the slice is the percentage. With waffle pieces, I can tell that one portion is larger or smaller, but the proportions are more difficult to quickly ascertain. The waffles are only better if there are lots of tiny parts that are difficult to see in a pie chart. Each piece of a waffle is the same size, while each pie slice is a different size. 1% is easier to see on a waffle than on a pie, but so long as small numbers like that don't appear too often, pies are the way to go.

Usually pie charts are far superior, unless there are many small percentages present.