Hello! I come with bad news, because I know performance issues are always the worst to debug. 😅 Especially second-hand when some user reports them and they don't appear in your own testing.
So I am currently implementing tooltips in my game and I noticed that sometimes when the text is set, I get a small lag-spike.
I think it's hard to see in the gif, but here is what I am doing none the less:

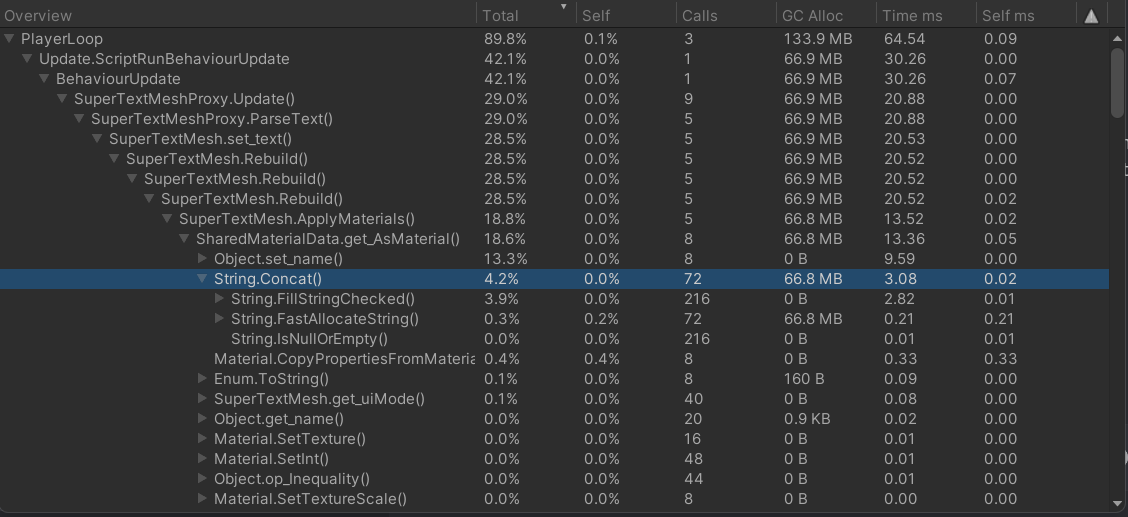
I've done a bunch of profiling and tinkering with my own system behind it, but I found the culprit.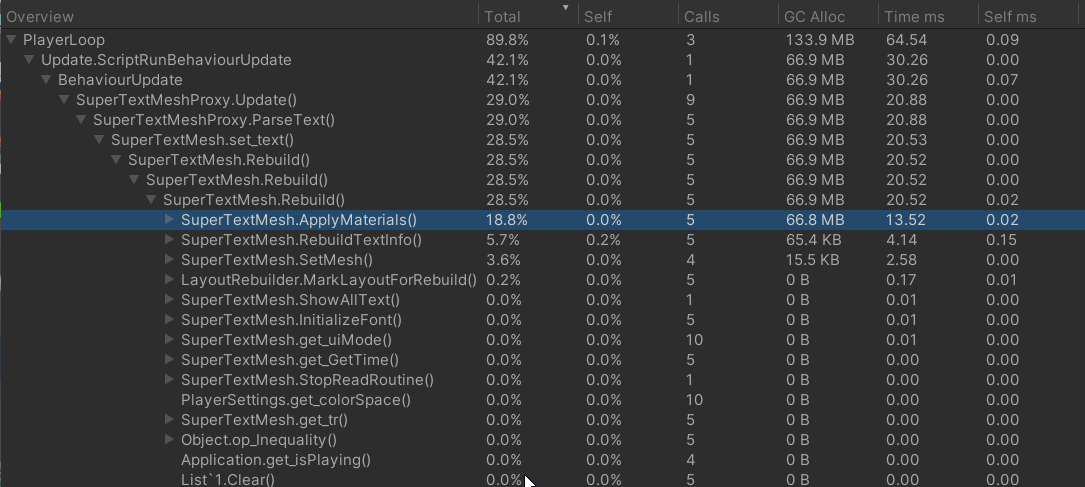
In the profiler it first doesn't look bad, but just to try it, I've put a 'return' at the start of the ApplyMaterials() method and it fixes the lag-spike completely. Now... obviously the quads aren't updated and shown either now. (I have not exactly understood the code, but it seems the materials are updated and submeshes are set or something, and as we've talked before, submeshes correlate to quads.)
The tooltip panel in the GIF is actually re-using the same one and setting new text. I assume when the text is set, the materials are updated to the needed ones for this specific text, this seems to sometimes lead to a small lag-spike.
At least from what I can gather.
Now I am not even saying this is some bigger problem that you have to fix with the asset (I don't know if it even is), maybe it's a problem with my setup?
Got any suggestions how I could remedy this? It would be great if the ApplyMaterials() wouldn't have to be called on every rebuild and just keep all materials in it, even if this specific instance of text is not using some of them. Does that make sense?
Would love your help and input.
Oh and btw.:
- In a build this lag-spike is not appearing for me, it's only happening in Unity Editor.
- I have not tested it on a weaker machine yet, but I usually try to make things run smooth also while in Editor. (Builds always seem to run smoother and more powerful anyways.)
- This is on the version you sent me in the e-mail.
- I checked warnings but couldn't find anything related to STM.
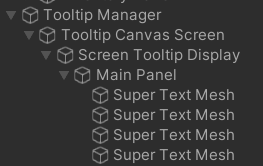
- If you wonder why the call in the profiler is made 5 times, it's because I got 5 lines of text after another. Text is split in groups so I can adjust spacing between lines and also I wanted the reading animation to start from each line at the same time as seen in the GIF. I also attempted to cut this down to 1 component (and just join the string via \n) but it didn't really solve the issue, the spike was still noticeable sometimes.
- Part of the lag-spike is also coming from a ContentSizeFitter I have on my objects but I also removed that one for testing and the culprit still seemed to be the ApplyMaterials() call.
- I tested it both on a World Space and Screen Space - Camera canvas and it happens on both.
- I tested it both with the Universal and Ultra shaders and it made no difference.
- I tested PixelSnap off and it on and it made no difference.
- I tested with and without 'reading-feature', also made no difference.
- I also disabled all my internal regex parsing, layout components and everything else and still felt the spike.
EDIT: Expanded hierarchy further for you.