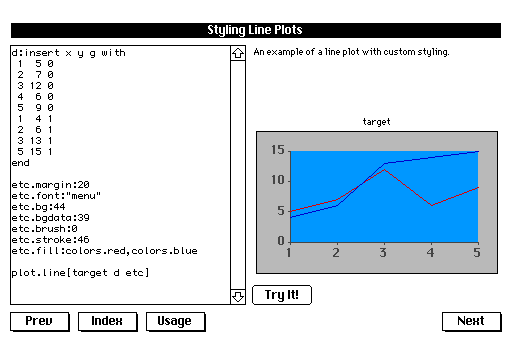
Plot was the first extension module I wrote for Decker, and has remained largely the same since Decker v1.0. I decided to revisit it in order to rework the documentation to better match other utility modules, and along the way added a number of enhancements:
- Configurable colors/patterns, font, and brush selections for plotting.
- Configurable x/y axis windowing features for most plot types, as applicable.
- Support for drawing pie charts.
- Utility functions for performing pivot/unpivot operations upon tables, making it easier to prepare "tidy" data for plotting and/or format "tidy" data for summary displays.

Please give it a spin and let me know if you run into any problems or points of confusion in the documentation:


