
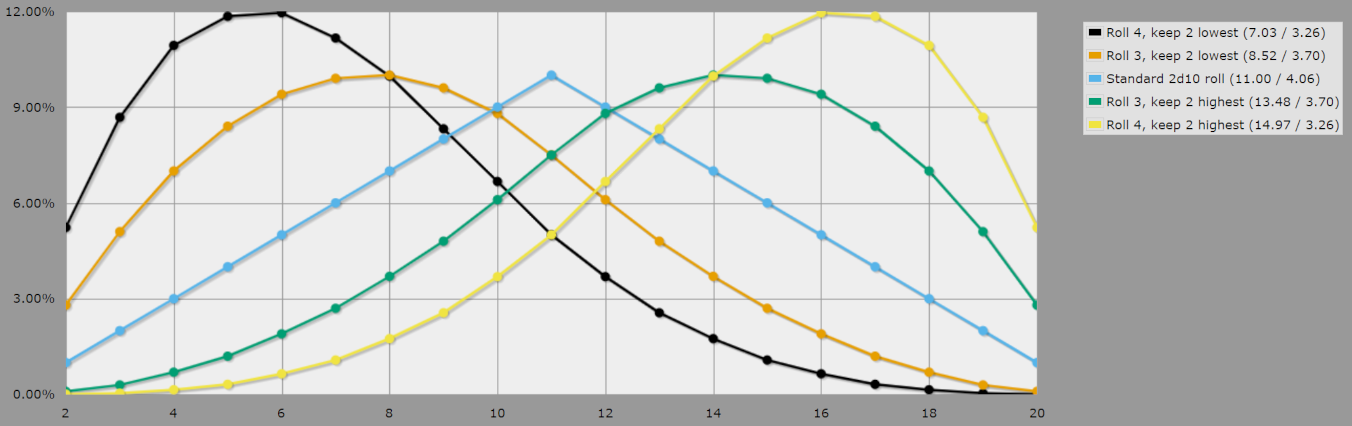
If interested, this is the graph showing the % of getting a specific number on a standard roll, and on the various Bonus or Penalty rolls (ie. rolling more dice and keeping the 2 highest or the 2 lowest).
I usually don't rely on very low chances to get a value (ok, good luck sometime helps, but a mercenary relying on luck is a dead mercenary).
Said so, as you can see the value you get a lot with the standard roll is 11 (pretty simple to get it), and you have very low chance to get a 4- or a 18+.
- If you have Bonus, you usually get at least a ~13, and it's pretty easy to get a 19 too, while it's very rare to get 7- (in short, it's somewhat similar to get a "+3" to a standard roll, even better).
- If you have Double Bonus, your average result is 15, and you'll score 19+ with about 14% chances (critical, baby!). Conversely, the chances for a result of 9- are very rare (and you can forget to suffer a fumble).
- If you have Penalty, the numbers are inverted, so your average result is ~9, it's easy to get a fumble of 3-, and it's very rare to hit a 15+.
- If you have Double Penalty, pray. Your average result is 7, you'll get a 3- fumble with 14% chances, and you can't hope to get the values of 13+.
Thanks for the breakdown! I used similar graphs when I started designing the skills.
I was aiming for a balance between the simplicity of a advantage/disadvantage system with some more granularity for the complexity of a cyberpunk heist.