
Memory Watcher
This contraption shows a log of Native Decker’s memory usage. I thought Decker was using a lot of memory, but it turned out that I just didn’t understand how it was supposed to work, and studying this helped me figure it out.
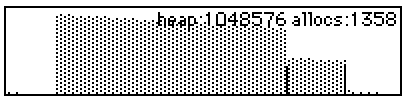
The graph scrolls to the right, so the newest data is on the left. The height of the graph represents the total size of Decker’s heap (which is given as a specific number in the caption at the top). The black lines represent how many allocations were added on that frame (“allocs” in the caption is the number of allocations in the most recent frame), and the dithered portion represents how full the heap is.
In the screenshot above, you can see the heap was pretty empty, then I did some things that created a lot of allocations, and the heap filled up. When it gets above 90% or so, Decker cleans up all the unused allocations, freeing up space to do more allocations in future.
The lesson I learned is that it’s better to do lots of small memory allocations over several frames than one big memory allocation, especially if there’s a chance your big memory allocation might happen when the heap is already quite full. Badly-timed allocations can balloon the heap until it’s 10 times bigger than your allocation, and that can be gigabytes of memory.
%%WGT0{"w":[{"name":"memwatcher1","type":"contraption","size":[199,45],"pos":[182,265],"def":"memwatcher","widgets":{"history":{"size":[199,45]},"lastallocs":{"size":[199,16],"pos":[0,77]},"lastheap":{"size":[199,16],"pos":[0,93]},"label":{"size":[199,45]}}}],"d":{"memwatcher":{"name":"memwatcher","size":[96,96],"resizable":1,"margin":[2,3,5,3],"description":"A live-updating log of Decker's memory usage.\n\nThe dithered area represents how full Decker's heap is, the solid area represents new allocations on that frame.","image":"%%IMG2AGAAYABQAQEA/wD/AP8A/wD/AP8A/wD/AP8A/wD/AP8A/wD/AP8A/wD/AP8A/wD/AP8A/wD/AP8A/wD/AP8A/wD/AP8A/wD/AP8A/wD/ANI=","widgets":{"history":{"type":"canvas","size":[96,96],"pos":[0,0],"locked":1,"animated":1,"volatile":1,"script":"on view do\n # Extract values we'll need a lot\n lheap:0+lastheap.text\n cheap:sys.workspace.heap\n lallocs:0+lastallocs.text\n callocs:sys.workspace.allocs\n clive:sys.workspace.live\n cw:history.lsize[0]\n ch:history.lsize[1]\n\n\n # If the heap size has changed,\n # scale the histogram\n i:history.copy[0,0 history.lsize]\n if cheap > lheap\n i:i.scale[1,lheap/cheap \"bottom_center\"]\n end\n\n # Scroll the histogram along\n history.clear[]\n history.paste[i (1,0) 0]\n\n # Draw a stipple for how full the heap is\n barh:ch*clive/cheap\n history.pattern:12\n history.line[0,ch 0,ch-barh]\n\n # Draw a solid line for how much was allocated this frame.\n barh:ch*(callocs-lallocs)/cheap\n history.pattern:1\n history.line[0,ch 0,ch-barh]\n\n label.text:\"heap:%i allocs:%i\" format cheap,callocs-lallocs\n\n lastheap.text:cheap\n lastallocs.text:callocs\nend","scale":1},"lastallocs":{"type":"field","size":[96,16],"pos":[0,128],"volatile":1},"lastheap":{"type":"field","size":[96,16],"pos":[0,144],"volatile":1},"label":{"type":"field","size":[96,96],"pos":[0,0],"locked":1,"volatile":1,"show":"transparent","border":0,"style":"plain","align":"right"}}}}}