
Hello, first of all, congratulations on this great update. The program is progressing wonderfully. Here, rmsuccess seems to be talking about a complete stereo image, I think. The sum of Mid + Side signals. I also looked for this for the VU meter. With your permission, I'm also curious about a few other things, and I hope it's not wrong to ask them here without opening a new topic. Is it possible for us to assign different colors for Mid and Side on the spectrum? Currently, we can separate these channels, but I guess we can't color them separately for mid and side. It would be great if we could. It looks a bit confusing as it is. Also, when I try to upload a reference track for the spectrum in .wav or .mp3 formats, it gives an "Encoding Failed" warning. I don't have the other formats right now, so I couldn't try them. I don't quite understand if I'm doing something wrong. It would be good if you could check. Another request is related to the Loudness module: It would be great if the captured peaks could be written on the right, just like in the LUFS values, maybe with a different color. These values might not need to go up and down with the graph. The captured values could be transferred statically, just like in the current LUFS table, but with different colors. (I uploaded an image about this.) Could such an option be offered to us? Do you think this is possible? All the best.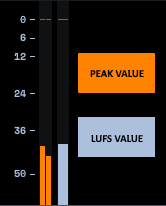
Hey!
I see. I will look into the sum of Mid and Side. If there is another tool that does this properly I would be happy to see how they have done it. Let me know.
As for the colors of the Mid / Side in the Spectrum you can customize that in a theme: https://minimeters.app/help/theme-creation/
For the encoding failed errors, would you mind sending those files so I can see why they might be failing? Either reach out in the Discord or via contact@minimeters.app.
I will look into the other requests!
Joe
Appreciate your response Joe, as far as a tool that does this similarly. Possibly serato software does this with their waveforms. Since what they display is one complete mixed waveform with differentiated colors. (similar to mini meters)
Here is what i found online:
In Serato DJ software,
the visual representation of a stereo signal on the waveform display doesn't explicitly display the left and right channels as two separate, distinct waveforms.
Instead, Serato DJ's waveforms provide a combined view, indicating the frequency content and overall amplitude of the audio signal.
So in other words, if mini meters had an option in the "waveform" area, to display the complete stereo signal/complete audio content of a track, thereby allowing us to see the overall frequency content and overall amplitude of the audio signal.
Maybe adding options of either a sum(+) of mid/side channel mode or even a sum(+) of left/right channels mode?
hopefully this can help, cheers.
Rmsuccess