

Play tool
Microbit Survey Visualization Pie Chart's itch.io pageURL to MakeCode Project
https://makecode.microbit.org/_i1h477fyoCpr
The Problem
Imagine being able to provide your audience a visually engaging and instantaneous way of demonstrating group sentiment? Written surveys are no good, we need data visualization!
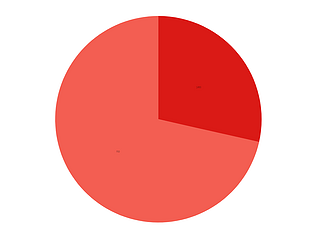
The Solution
We use a microbit as a physical ‘yes’ or ‘no’ voting device to render a real time pie chart based on how many clicks each category has received. The microbit code is simply sending a yes or no vote and the Node Serialport library provides the access to our microbit controller in order to receive data from the device into an express based web server with vue as the frontend user interface. Socket IO is used to send messages from the server into the client, its final resting place as the data that powers our pie chart, powered by the Chartist visualization library.
Leave a comment
Log in with itch.io to leave a comment.
Comments
No one has posted a comment yet