Indie game storeFree gamesFun gamesHorror games
Game developmentAssetsComics
SalesBundles
Jobs
TagsGame Engines

JoromeAX

2
Posts
1
Topics
1
Following
A member registered 52 days ago

Recent community posts

Hi Deakcor,

Thank you for responding and releasing the patch so quickly. I updated the Steam version to PixelOver 0.19.1.1 and continued working with the same project and 896×1344 RGB image.

The image-format error from my original report does not appear in the new session log. Thank you for fixing that.

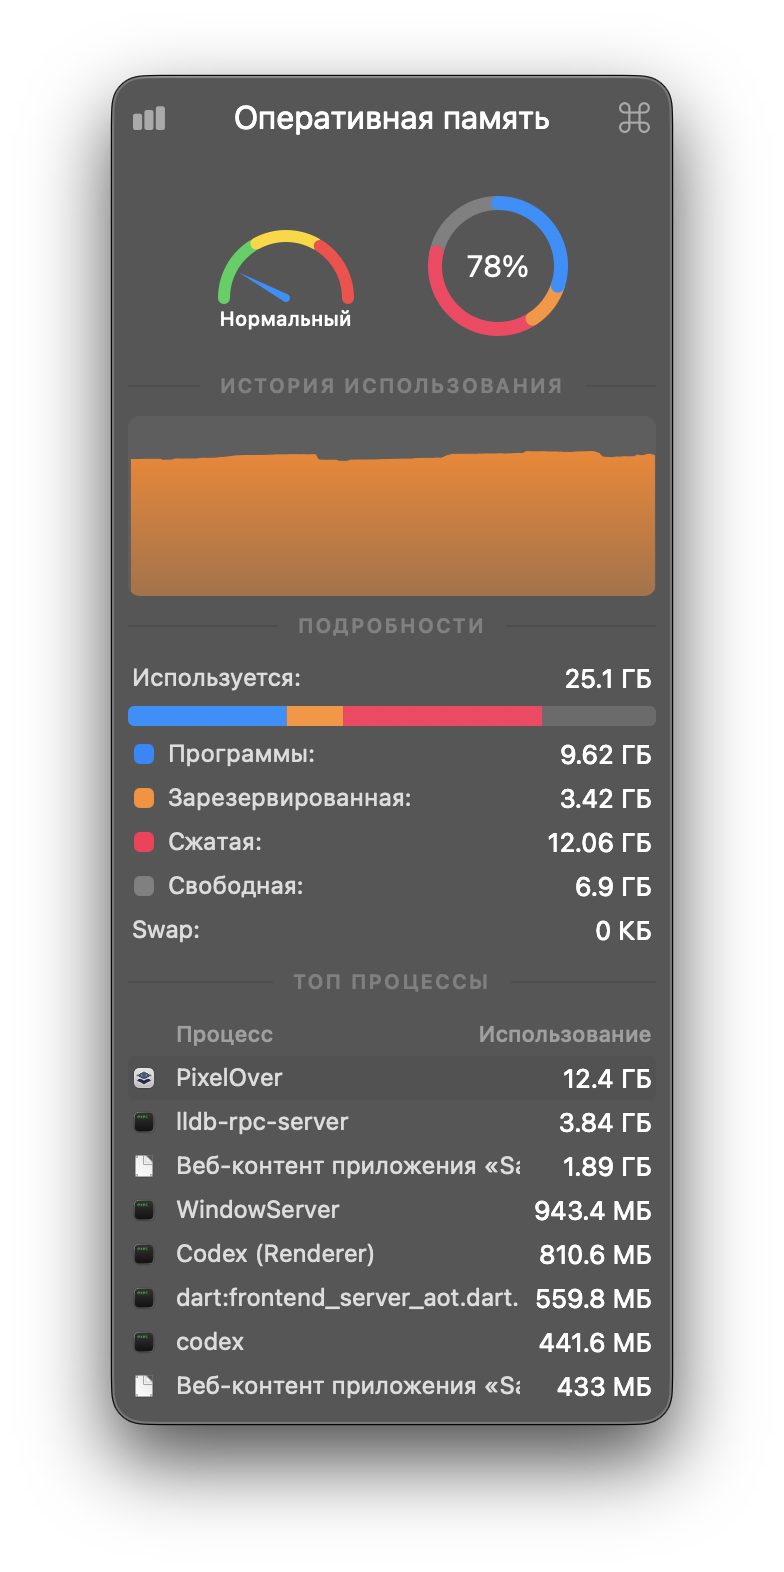
The memory attributed to PixelOver still rises when I draw or erase. It was about 353 MB just after launch, before opening the project; after approximately 38 minutes of work, Activity Monitor showed 9.09 GB. The Mac remained responsive, memory pressure was green, and disk swap was zero. A later vmmap capture from the same running process reported a 10.5 GB footprint, including 4.5 GB of owned unmapped (graphics) regions.

I also noticed repeated Condition "idx < 0" is true errors in the new log, often near undo activity. I don’t know whether they are related to the rising memory figure.

Both screenshots, the full new session log, and the vmmap output are in this folder: https://drive.google.com/drive/folders/1CqY2Ggl2U71wo_UFst4EGhtgVOMdy9lY

Could you take another look at what is being retained during drawing and erasing?
Hello,

I may have encountered a graphics-memory retention/leak issue in PixelOver 0.19.1 on macOS. I searched the existing Report topics but could not find the same issue.

Environment

- PixelOver 0.19.1 stable, Steam version

- macOS 26.5.2 (build 25F84)

- MacBook Pro (MacBookPro18,2)

- Apple M1 Max, 32-core integrated GPU

- 32 GB unified memory

- Metal renderer

Image used

- PNG, 896 × 1344 pixels

- 8-bit RGB, non-interlaced

- File size: 84 KB

Observed sequence

1. I launched PixelOver 0.19.1 and worked with the attached 896 × 1344 image in a 2D project.

2. After approximately nine minutes, Activity Monitor reported 12.4 GB of memory for PixelOver.

3. A `vmmap -summary` capture shortly afterwards reported a 12.8 GB physical footprint.

4. The application remained responsive and macOS compressed most of the allocation, but the memory remained attributed to the PixelOver process.

Observed memory details

- PixelOver physical footprint: 12.8 GB

- Writable regions: 13.1 GB total

- Compressed/swapped writable memory reported by vmmap: approximately 12.0 GB

- `owned unmapped (graphics)`: 11.5 GB

- Approximately 2,674 `owned unmapped (graphics)` regions

- Activity Monitor showed 12.06 GB compressed memory and 0 KB disk swap

The process RSS later appeared much smaller (approximately 650 MB), but `vmmap` still reported the 12.8 GB physical footprint because most of the graphics allocation had been compressed.

Log observation

The session log contains 7,447 repetitions of this error:

ERROR: Condition "p_dest->get_format() != p_src->get_format()" is true.

   at: merge (custom_modules/pixelover_module/po_image/po_image.cpp:511)

This repeated image-format error appeared during the same session as the graphics-memory growth.
The full session log is available on Google Drive:
https://drive.google.com/file/d/1_BsIL6ATFB2Aqw_XXEQBvel3NSsScrrg/view?usp=sharing

Expected result

PixelOver should reuse or release intermediate graphics buffers, and a single 896 × 1344 RGB image should not cause the process footprint to grow to approximately 12.8 GB.

Actual result

Graphics allocations accumulated to approximately 11.5 GB and remained retained/compressed while the PixelOver process stayed open.

Reproduction note

I have captured this occurrence with the full log and memory diagnostics, but I have not yet isolated the exact editor operation that begins the accumulation. Please let me know if you would like me to test a specific action, renderer setting, image format (RGB versus RGBA), or canvas size.