

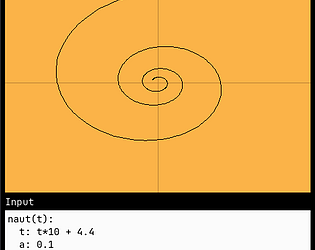
I'm trying to avoid too much "styling control" in the code itself, since it's not really designed as a "picture maker" and I don't want to burden the language syntax, but I've considered stuff like @color(255,128,64) and things of that nature as optional "style comments". I think the primary colorizing would come from a global "settings" menu though, so I'd just allow setting the entire app's color scheme (including the colors for each plotted graph, up to 16 or something). It's not that I don't want it to be used for making pictures, it's just that it's a deep rabbit hole of scope, so I need some kind of self imposed guardrails :P So at the moment it's something like "customizing colors to your liking makes sense, but customizing colors and styles for a perfect diagram to use elsewhere" probably doesn't make sense.
A member registered Aug 03, 2020 · View creator page →
Creator of
Recent community posts
You can already plot multiple functions actually, by listing them with commas, like so :)
f(x): x^2
g(x): sin(x)
f,g
Naut will "print" whatever it sees on the last line. If you give it a function (or a list), it will plot it (or them), and if you give it multiple numbers, it will print them.
It's a good idea to hover and highlight though! Custom colors could also be a thing, just need to add the idea of saving them to a user file somewhere (right now Naut doesn't load/save any data, it's self contained, but it wouldn't be a problem for "user customization" to live in some other folder I think)